Explore the database with easy-to-use data visualizations. Click on Table Builder, Map Builder or Graph Builder to see who is doing what, where, and how, and filter and sort results to focus on the topics that interest you. Check back soon for new ways to visualize the data!
Table Builder
Create your own table to show programs and organizations by topic, population, location, evaluation status, and much more.
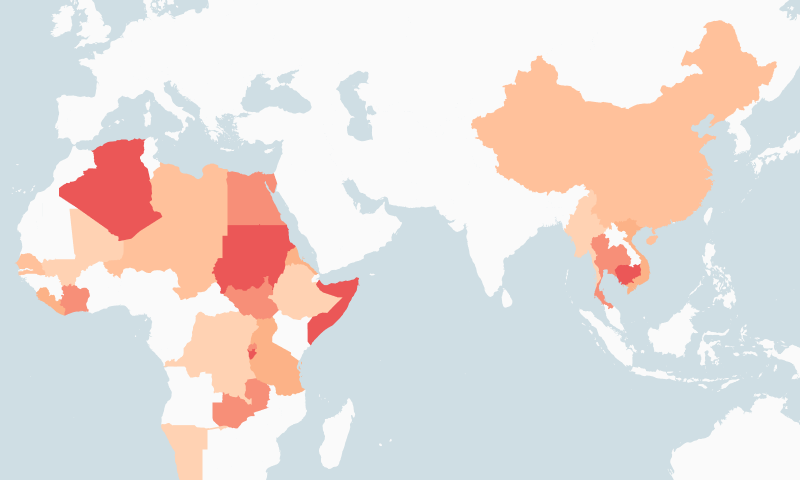
Map Builder
Customize your own map to see where programs are taking place, and where education needs are greatest.
Graph Builder
Customize your own graph to display and compare information about gender and education organizations and their programs.